
Category: MKT 410 – Digital Analytics

  • Why the Right KPIs Matter in Digital Marketing

    Why the Right KPIs Matter in Digital Marketing

    Digital marketing gives organizations access to an enormous amount of data. Marketers can measure impressions, clicks, website visits, engagement, conversions, bounce rates, email opens, and dozens of other metrics. However, having access to more data does not necessarily lead to better decisions. The real challenge is determining which measurements actually matter to the organization.

    This is where key performance indicators (KPIs) become important. KPIs allow marketers to focus on measurements that demonstrate progress toward specific business and marketing goals. Rather than reporting every available metric, organizations should identify the indicators that provide meaningful information about performance and can help guide future decisions.

    Connecting KPIs to Business Goals

    One of the most important principles when selecting KPIs is alignment with organizational goals. According to Jackson (2016), KPIs should connect measurement with the objectives an organization is trying to accomplish. Without this connection, marketers may spend too much time analyzing numbers that look impressive but provide little information about actual business performance.

    For example, imagine a company launches a social media campaign with the primary goal of increasing brand awareness. In this situation, reach, impressions, and brand mentions could be appropriate KPIs because they indicate how many people are being exposed to the brand. If the company’s goal is instead to generate qualified leads, impressions alone would not provide enough information. Metrics such as click-through rate (CTR), landing-page conversion rate, cost per lead, and qualified leads would provide a much stronger indication of whether the campaign is accomplishing its objective.

    This distinction is especially important because marketers have access to so many possible measurements. Meltwater (2026) notes that organizations should select social media KPIs based on the business outcome they are trying to achieve rather than using the same measurements for every campaign. For example, awareness campaigns can emphasize reach and impressions, while lead-generation campaigns should focus more heavily on conversion-related metrics.

    Using the REAN Model

    One useful approach for organizing KPIs is the REAN model, which divides the customer journey into four areas: reach, engage, activate, and nurture (Jackson, 2016). Each stage can be associated with different KPIs depending on what the organization wants customers to do.
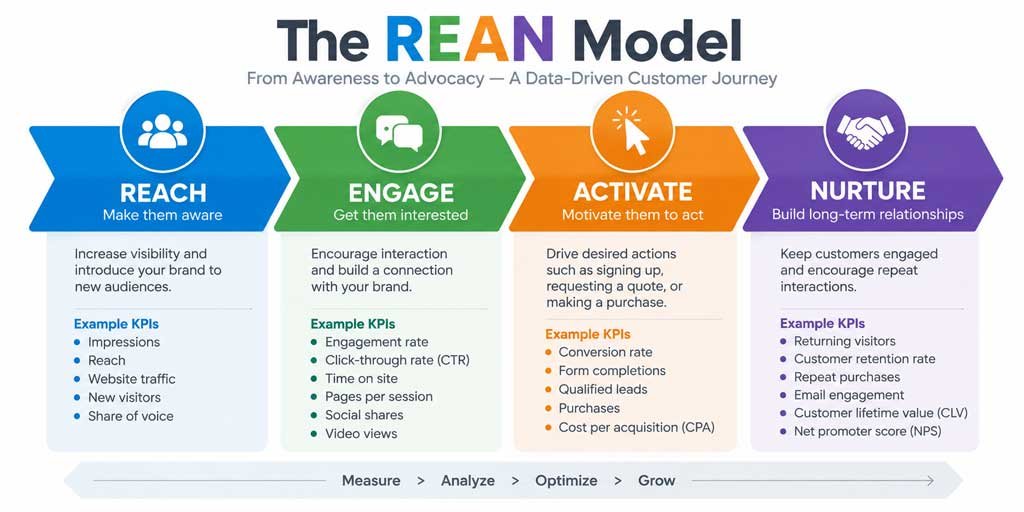
    Figure 1. The REAN model and examples of KPIs across the customer journey.

    In the reach stage, a company is trying to increase visibility among potential customers. Appropriate KPIs might include impressions, reach, website traffic, or new visitors. During the engage stage, marketers want to understand whether people are interacting with the brand. KPIs might include engagement rate, time spent on a page, content shares, or CTR.

    The activate stage focuses more directly on encouraging customers to take a desired action. Depending on the campaign, conversion rate, completed forms, purchases, or qualified leads could serve as KPIs. Finally, the nurture stage focuses on maintaining customer relationships. Returning visitors, repeat purchases, email engagement, retention, and customer lifetime value can help organizations evaluate whether they are successfully developing long-term relationships.

    Turning Data Into Decisions

    KPIs are valuable not only because they measure performance, but also because they help marketers decide what to do next. For example, a paid digital advertising campaign may generate a large number of impressions but have a low CTR. This could indicate that the campaign is reaching people but the creative, message, offer, or audience targeting is not motivating them to take the next step. Marketers could then test different headlines, visuals, calls to action, or audience segments and compare the results.

    Similarly, analyzing referral traffic can reveal which external sources are sending meaningful visitors to a website. Comparing new and returning visitors can also provide insight into whether content is attracting new audiences while continuing to engage existing ones (DeMers, 2025). These measurements become especially useful when marketers compare performance over time or against appropriate benchmarks.

    Ultimately, effective digital analytics is not about measuring everything. It is about measuring the right things. When KPIs are clearly connected to business goals, marketers can move beyond simply reporting numbers and begin using data to explain performance, improve campaigns, allocate resources more effectively, and support better business decisions.

    References

    DeMers, J. (2025). 50 content marketing metrics to measure your campaign. Meltwater.

    Jackson, S. (2016). Cult of analytics: Driving online marketing strategies using web analytics (2nd ed.). Routledge.

    Meltwater. (2026). Social media metrics and KPIs: What to measure in 2026. Meltwater.

  • Why Digital Marketing Works Better Across Departments

    Why Digital Marketing Works Better Across Departments

    Digital marketing campaigns may be managed by a marketing team, but their impact rarely stays within the marketing department. A campaign can affect sales, customer service, operations, IT, finance, and leadership. Each of these departments may also have different expectations for what a successful campaign should accomplish. Because of this, considering the needs of multiple departments can help organizations develop stronger campaigns and make better use of the data those campaigns generate.

    Breaking Down Organizational Silos

    One challenge within larger organizations is that departments can become isolated from one another. Marketing may have its own goals and information, while sales, customer service, IT, and other departments operate with different priorities and data. Jackson (2016) explains that these information silos can create inefficiencies and become a major obstacle for organizations trying to become more data guided.

    The hub-and-spoke method provides an approach for breaking down these silos. At the center is an information hub organized around people, processes, and tools, while the spokes represent the different business units or areas of the organization. The hub is responsible for supplying those areas with useful information derived from data and creating processes that allow the organization to make better use of its existing resources (Jackson, 2016).

    Digital analytics professionals play an important role within this hub. Their responsibility goes beyond simply collecting data and creating reports. They can work with different departments to understand their needs, identify opportunities, answer business questions, and help transform data into actions that improve performance.

    Better Campaigns Start With Shared Goals

    Cross-departmental collaboration is especially valuable before a digital marketing campaign launches because different departments may define success differently. Marketing might focus on engagement, website traffic, or conversions, while sales may be more concerned with qualified leads and revenue. Customer service can provide insight into common customer concerns, while IT can determine whether the technology needed to support and measure the campaign is working correctly.

    For example, imagine a company is developing an email campaign to promote a new service. Marketing may create the message, design, and landing page, but sales could provide information about common questions or objections from prospective customers. Customer service could identify recurring concerns among existing customers, while IT could help ensure that the website, CRM, email platform, and analytics tools work together properly.

    Bringing these perspectives together can also help marketers establish more meaningful key performance indicators (KPIs). Instead of simply asking how many people opened an email or clicked a link, the organization can examine what happened afterward. Did those visitors become qualified leads? Did the leads become customers? Did the campaign ultimately contribute to revenue? These questions connect marketing performance to broader organizational goals.

    Turning Analytics Into Action

    The ACME example presented by Jackson demonstrates how the hub-and-spoke approach can work in practice. Instead of keeping analytics professionals separated from the departments they supported, analysts were placed closer to the marketing team. This allowed them to better understand marketing’s challenges and work directly with marketing, CRM, IT, and leadership to develop solutions (Jackson, 2016).

    The collaboration led ACME to identify opportunities involving email automation, audience segmentation, campaign tagging, and remarketing. Rather than simply reporting what had already happened, the analytics team helped determine what could be improved and how the organization could act on the information. According to Jackson (2016), the resulting efforts generated approximately $17 million in new sales during a six-month period.

    What stands out to me about this example is that analytics alone did not produce the result. The improvement came from people in different areas of the organization sharing information, combining their expertise, and working toward common goals.

    Sharing Results Creates More Value

    Cross-departmental collaboration should continue after a campaign launches. Analytics becomes much more valuable when results are shared with the departments that can use the information to make decisions.

    For example, digital analytics might reveal that one audience segment generates significantly more conversions than another. Marketing could use that information to adjust targeting, sales could prioritize stronger leads, and leadership could consider the results when making future investment decisions. Similarly, if visitors frequently reach a product or service page but rarely convert, the data could start a larger conversation about messaging, pricing, customer concerns, or website usability.

    Sharing results can also provide context that analytics alone may not reveal. A dashboard can show what happened, but employees in sales, customer service, IT, or other departments may help explain why it happened. Combining quantitative data with knowledge from across the organization can create a more complete understanding of campaign performance.

    From Marketing Data to Business Intelligence

    Digital analytics should be more than a reporting function. The hub-and-spoke method demonstrates how organizations can organize people, processes, tools, and information so that data becomes useful and actionable across different areas of the business (Jackson, 2016).

    Ultimately, a digital marketing campaign should not succeed only for the marketing department. Its success should contribute to broader organizational goals. By involving multiple departments during campaign development and sharing results afterward, organizations can break down information silos, establish more meaningful measures of success, and turn marketing analytics into insights that support better business decisions.

    Reference

    Jackson, S. (2016). Cult of analytics: Driving online marketing strategies using web analytics (2nd ed.). Routledge.